RQ3 : Whether and to what extent have the code clones in deep learning projects caused co-changes?
Glossary
- POC : Percentage of the clones.
- PCC : Percentage of co-changed clones.
- Size : Size of a project.
- LC : Loc of a clone.
- PCTC : Percentages of co-changed clones to all clones.
- PLOC : the number of lines of python code;
- NormPCTC : the percentage of co-changed in each line of clones;
The association between POC and PCC
Overview
| 0 - 5% | 5 - 10% | 10 - 15% | 15 - 20% | 20 - 25% | 25 - 30% | > 30% | |
|---|---|---|---|---|---|---|---|
| AvgPCC | 7.3% | 9.2% | 16.7% | 11.1% | 9.0% | 14.8% | 49.0% |
Parts
- part 1 : 0 - 5%
| POC | PCC | |
|---|---|---|
| deepvariant | 4.5% | 31.3% |
| pytorch-lightning | 4.0% | 0 |
| GPflow | 3.4% | 0 |
| OpenNMT-py | 3.4% | 0 |
| torchio | 3.2% | 0 |
| tensorpack | 1.1% | 12.5% |
| Avg | 3.2% | 7.3% |
- part 2 : 5 - 10%
| POC | PCC | |
|---|---|---|
| DeepLabCut | 9.5% | 16.7% |
| DeepPavlov | 8.7% | 2.0% |
| PySyft | 8.4% | 0 |
| raster-vision | 8.2% | 0 |
| MONAI | 7.0% | 32.3% |
| spaCy | 6.9% | 0 |
| ray | 6.4% | 5.9% |
| Hub | 5.2% | 16.7% |
| Avg | 7.6% | 9.2% |
- part 3 : 10 - 15%
| POC | PCC | |
|---|---|---|
| ludwig | 15.0% | 38.7% |
| catalyst | 13.5% | 39.5% |
| tensor2tensor | 13.4% | 0.7% |
| allennlp | 12.2% | 7.5% |
| luminoth | 11.9% | 4.5% |
| coach | 10.8% | 17.9% |
| clearml | 10.5% | 17.3% |
| TTS | 10.3% | 7.0% |
| Avg | 12.2% | 16.7% |
- part 4 : 15 - 20%
| POC | PCC | |
|---|---|---|
| tfx | 20.0% | 3.7% |
| chainer | 19.2% | 2.4% |
| autokeras | 16.7% | 18.8% |
| torch-points3d | 16.0% | 10.2% |
| stellargraph | 15.1% | 20.6% |
| Avg | 17.4% | 11.1% |
- part 5 : 20 - 25%
| POC | PCC | |
|---|---|---|
| nni | 23.8% | 3.1% |
| texar | 23.1% | 17.5% |
| horovod | 22.5% | 2.8% |
| sonnet | 22.4% | 0 |
| transformers | 21.6% | 6.6% |
| keras | 21.2% | 16.0% |
| DIG | 20.6% | 23.7% |
| addons | 20.1% | 2.6% |
| Avg | 21.9% | 9.0% |
- part 6 : 25 - 30%
| POC | PCC | |
|---|---|---|
| TensorLayer | 29.7% | 14.2% |
| imgaug | 28.8% | 15.9% |
| deepchem | 28.2% | 4.5% |
| pyod | 25.7% | 24.7% |
| Avg | 28.1% | 14.8% |
- part 7 : > 30%
| POC | PCC | |
|---|---|---|
| tianshou | 51.1% | 77.9% |
| ignite | 38.9% | 7.0% |
| tflearn | 35.4% | 62.1% |
| Avg | 41.8% | 49.0% |
Association between Size and PCC
| Subject | PLOC | PCC |
|---|---|---|
| tianshou | 21,257 | 75.3% |
| tflearn | 10,297 | 62.1% |
| catalyst | 30,581 | 39.3% |
| ludwig | 42,097 | 38.7% |
| MONAI | 72,288 | 32.3% |
| deepvariant | 35,254 | 30.6% |
| pyod | 10,769 | 24.7% |
| DIG | 22,257 | 23.1% |
| stellargraph | 27,816 | 20.6% |
| autokeras | 10,417 | 18.8% |
| coach | 24,709 | 17.9% |
| texar | 31,757 | 17.1% |
| clearml | 84,867 | 17.3% |
| DeepLabCut | 30,419 | 16.7% |
| Hub | 22,636 | 16.7% |
| keras | 146,799 | 15.9% |
| imgaug | 89,115 | 15.9% |
| TensorLayer | 29,952 | 14.2% |
| tensorpack | 24,811 | 12.5% |
| torch-points3d | 25,560 | 10.2% |
| allennlp | 56,320 | 7.5% |
| TTS | 25,247 | 7.0% |
| ignite | 41,000 | 6.9% |
| transformers | 449,759 | 6.6% |
| ray | 260,916 | 5.9% |
| luminoth | 11,467 | 4.5% |
| deepchem | 60,320 | 4.5% |
| tfx | 80,696 | 3.7% |
| nni | 80,385 | 3.1% |
| horovod | 36,344 | 2.8% |
| addons | 28,214 | 2.6% |
| chainer | 132,991 | 2.4% |
| DeepPavlov | 27,778 | 2.0% |
| tensor2tensor | 86,231 | 0.7% |
| GPflow | 20,484 | 0 |
| OpenNMT | 14,224 | 0 |
| PySyft | 58,479 | 0 |
| pytorch-lightning | 60,251 | 0 |
| raster-vision | 16,718 | 0 |
| sonnet | 13,172 | 0 |
| spaCy | 76,679 | 0 |
| torchio | 12,408 | 0 |
| DeepFaceLab | 12,831 | 0 |
| faceswap | 28,756 | 0 |
| pytorchvideo | 19,058 | 0 |
We calculated the Pearson correlation coefficient between the size and percentage of co-changed clones of each project,which get a value of 0.05.
Association between LC and co-changed clones.
Association between LC and PCTC.
Overview
| 5-20 | 21-40 | 41-60 | 61-80 | 81-100 | 101-∞ | |
|---|---|---|---|---|---|---|
| PCTC | 5.7% | 11.9% | 8.9% | 33.5% | 48.5% | 60.4% |
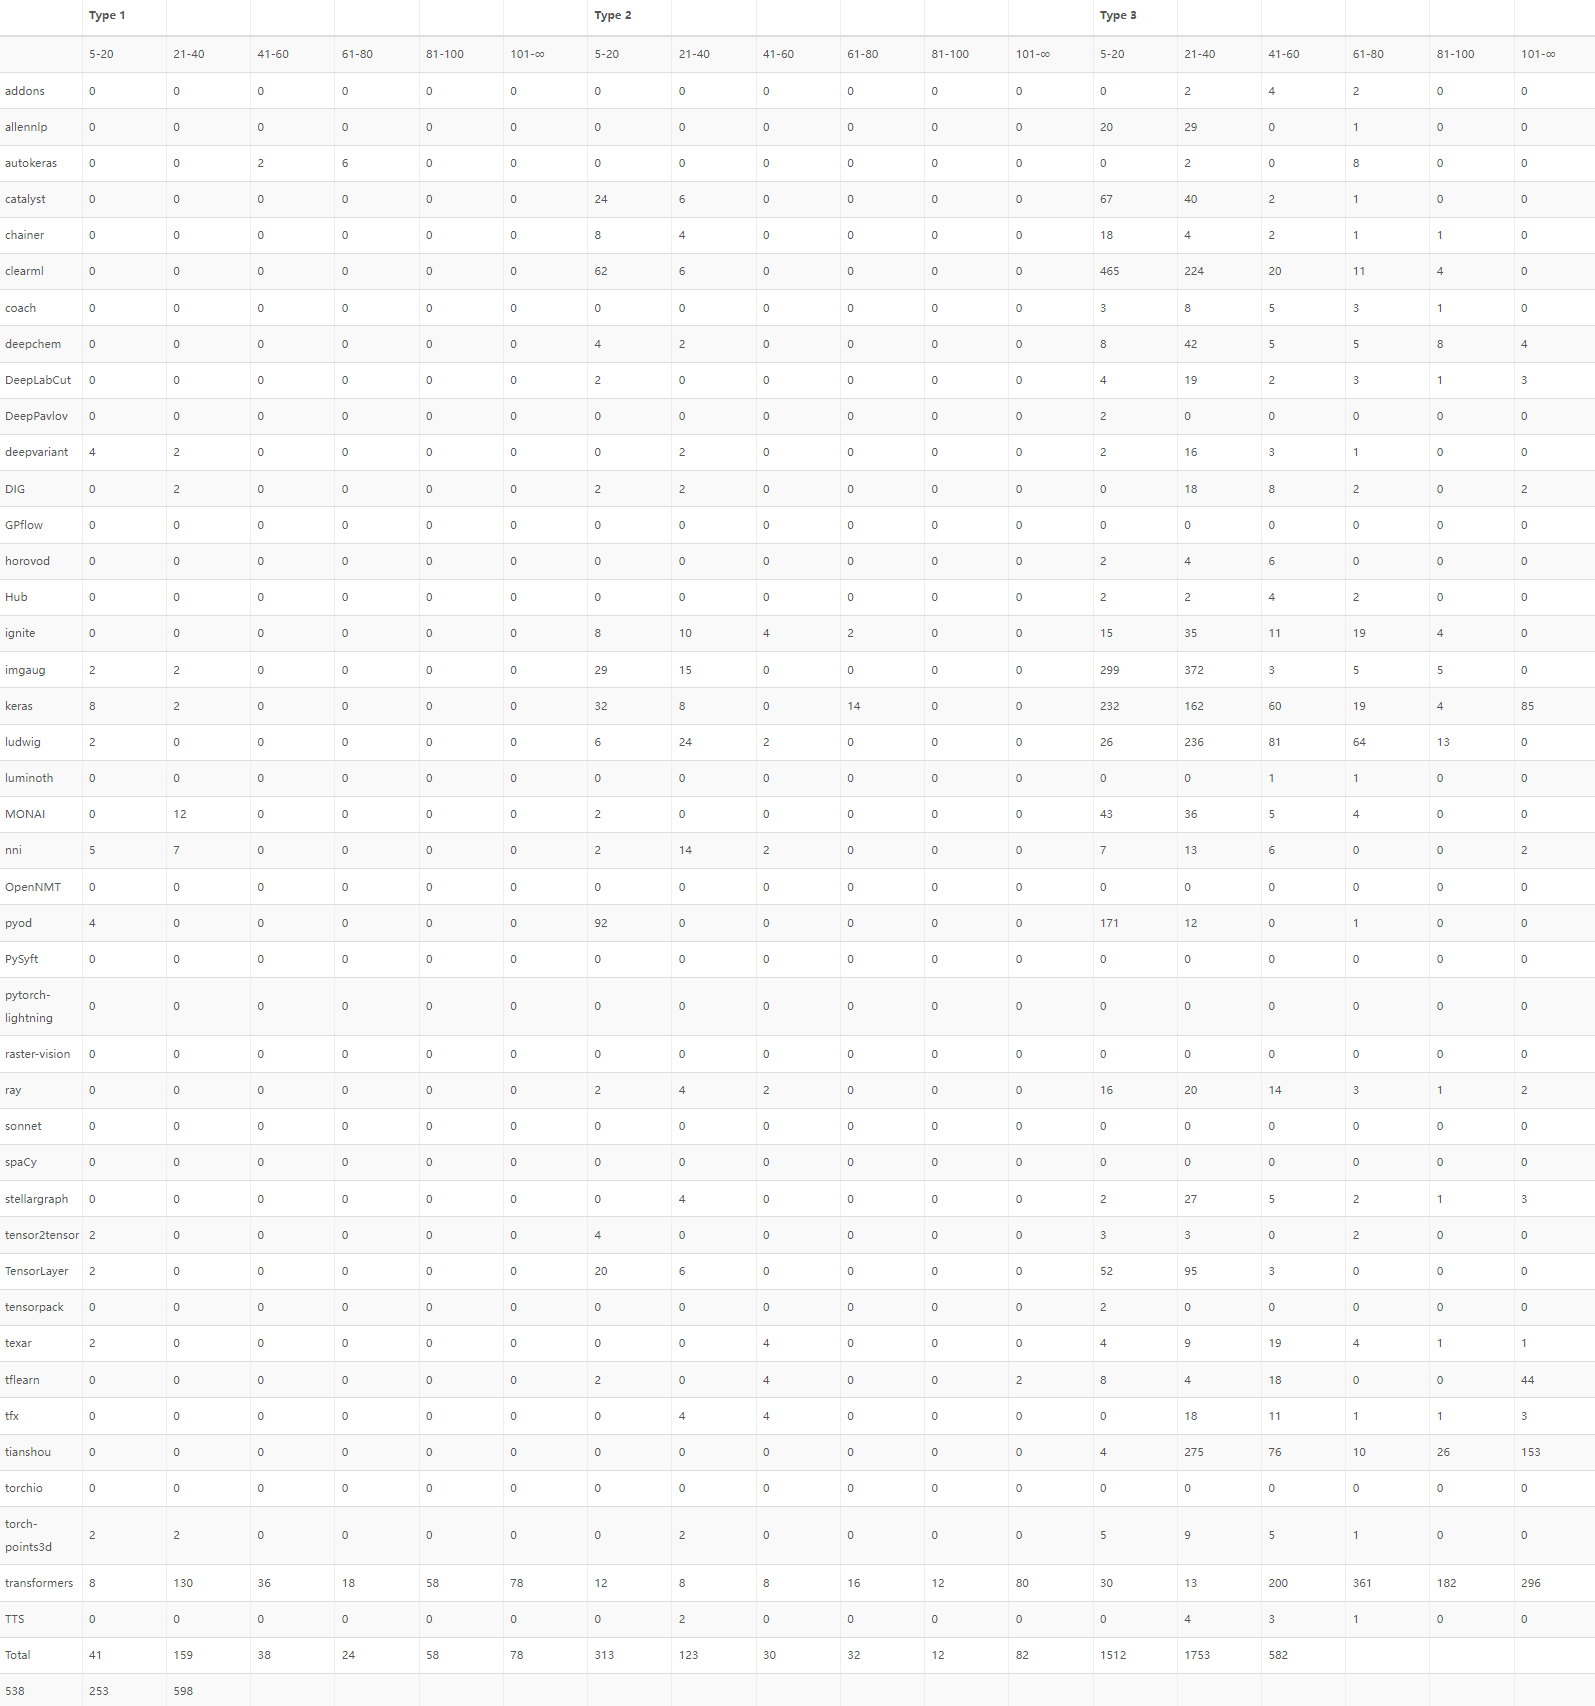
Distribution of the number of each co-modified clone type.
| 5-20 | 21-40 | 41-60 | 61-80 | 81-100 | 101-∞ | |
|---|---|---|---|---|---|---|
| Type1 | 41 | 159 | 38 | 24 | 58 | 78 |
| Type2 | 313 | 123 | 30 | 32 | 12 | 82 |
| Type3 | 1512 | 1753 | 582 | 538 | 253 | 598 |
| Total | 1866 | 2035 | 650 | 594 | 323 | 758 |
Distribution of the number of each co-modified clone type in every project

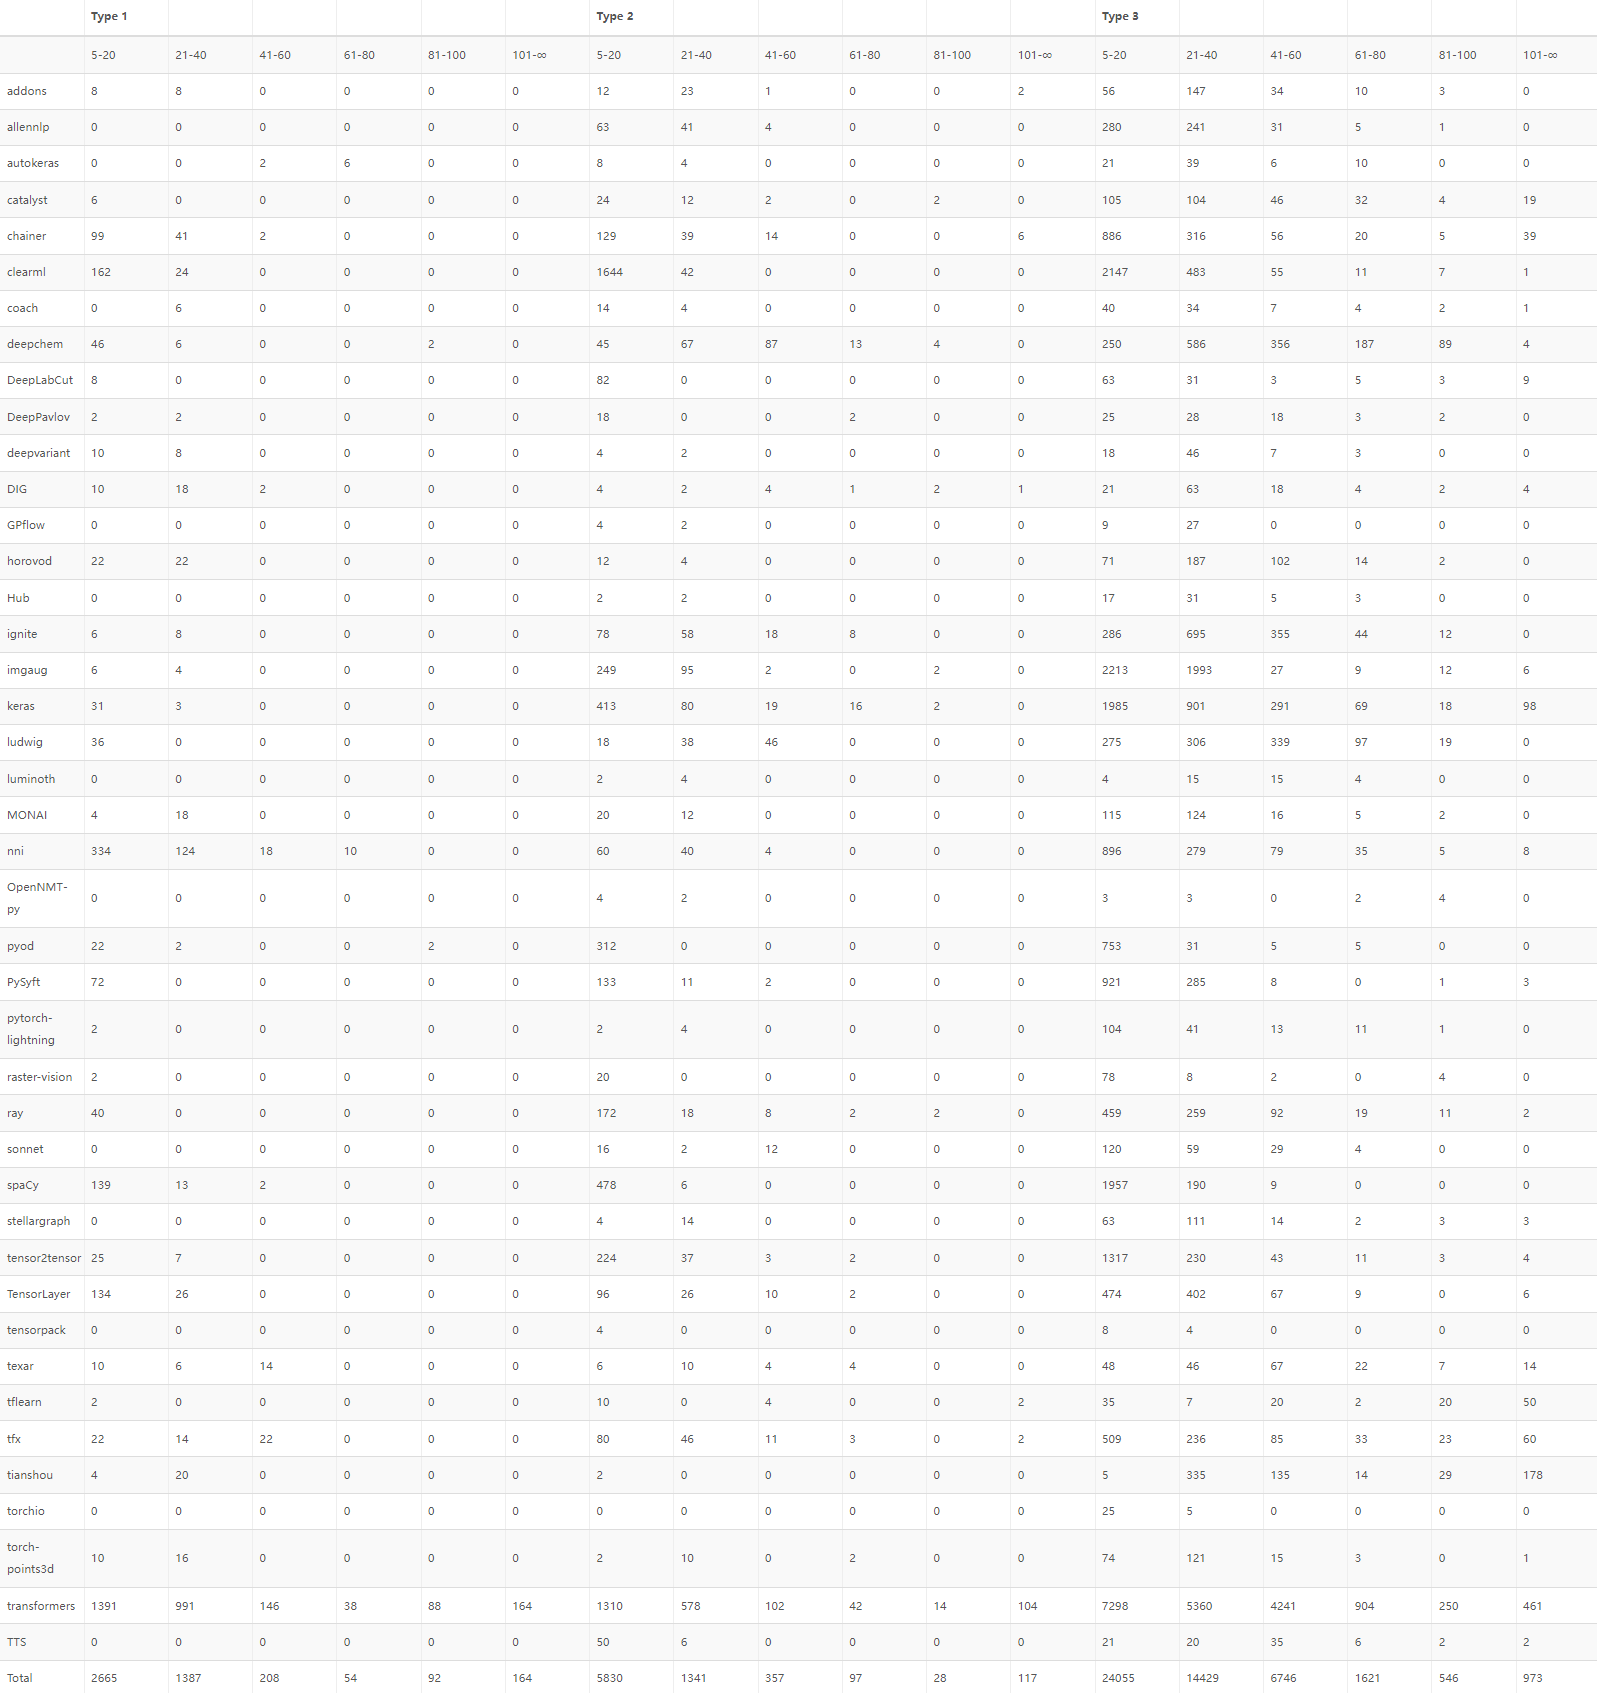
Distribution of the number of each clone type.
| 5-20 | 21-40 | 41-60 | 61-80 | 81-100 | 101-∞ | |
|---|---|---|---|---|---|---|
| Type 1 | 2665 | 1387 | 208 | 54 | 92 | 164 |
| Type 2 | 5830 | 1341 | 357 | 97 | 28 | 117 |
| Type 3 | 24055 | 14429 | 6746 | 1621 | 546 | 973 |
| Total | 32550 | 17157 | 7311 | 1772 | 666 | 1254 |
Distribution of the number of each clone type in every project.

Association between LC and NormPCTC.
Overview
| 5-20 | 21-40 | 41-60 | 61-80 | 81-100 | >101 | |
|---|---|---|---|---|---|---|
| NormPCTC | 8.7% | 13.5% | 18.8% | 33.4% | 44.4% | 49.3% |
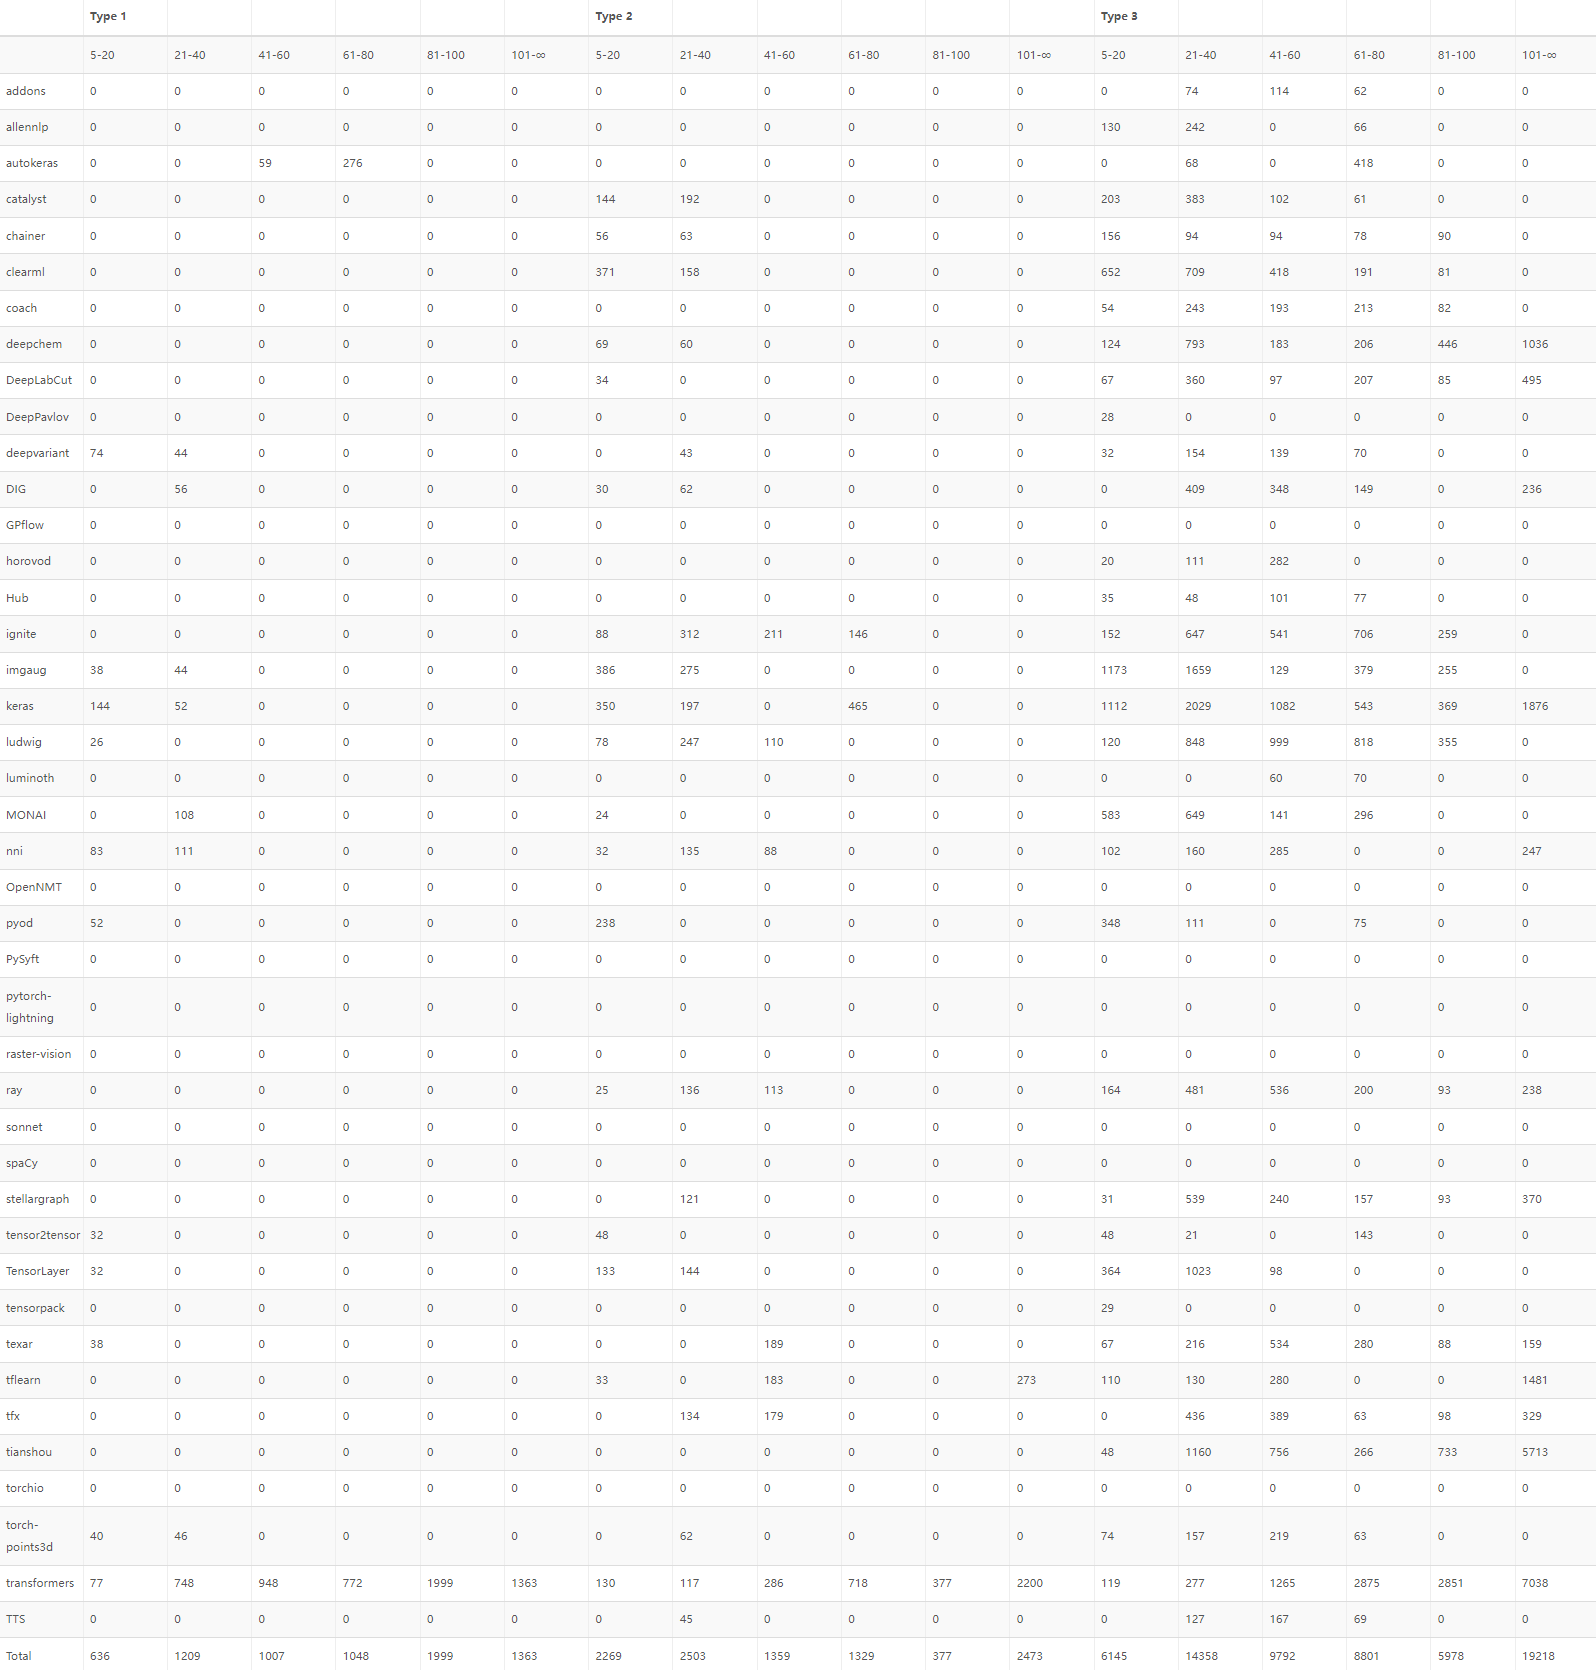
Distribution of the gross LOC of each co-changed clone type in every group.
| 5-20 | 21-40 | 41-60 | 61-80 | 81-100 | 101-∞ | |
|---|---|---|---|---|---|---|
| Type 1 | 636 | 1209 | 1007 | 1048 | 1999 | 1363 |
| Type 2 | 2269 | 2503 | 1359 | 1329 | 377 | 2473 |
| Type 3 | 6145 | 14358 | 9792 | 8801 | 5978 | 19218 |
| Total | 9050 | 18070 | 12158 | 11178 | 8354 | 23054 |
Distribution of the gross LOC of each co-changed clone type in every group and project

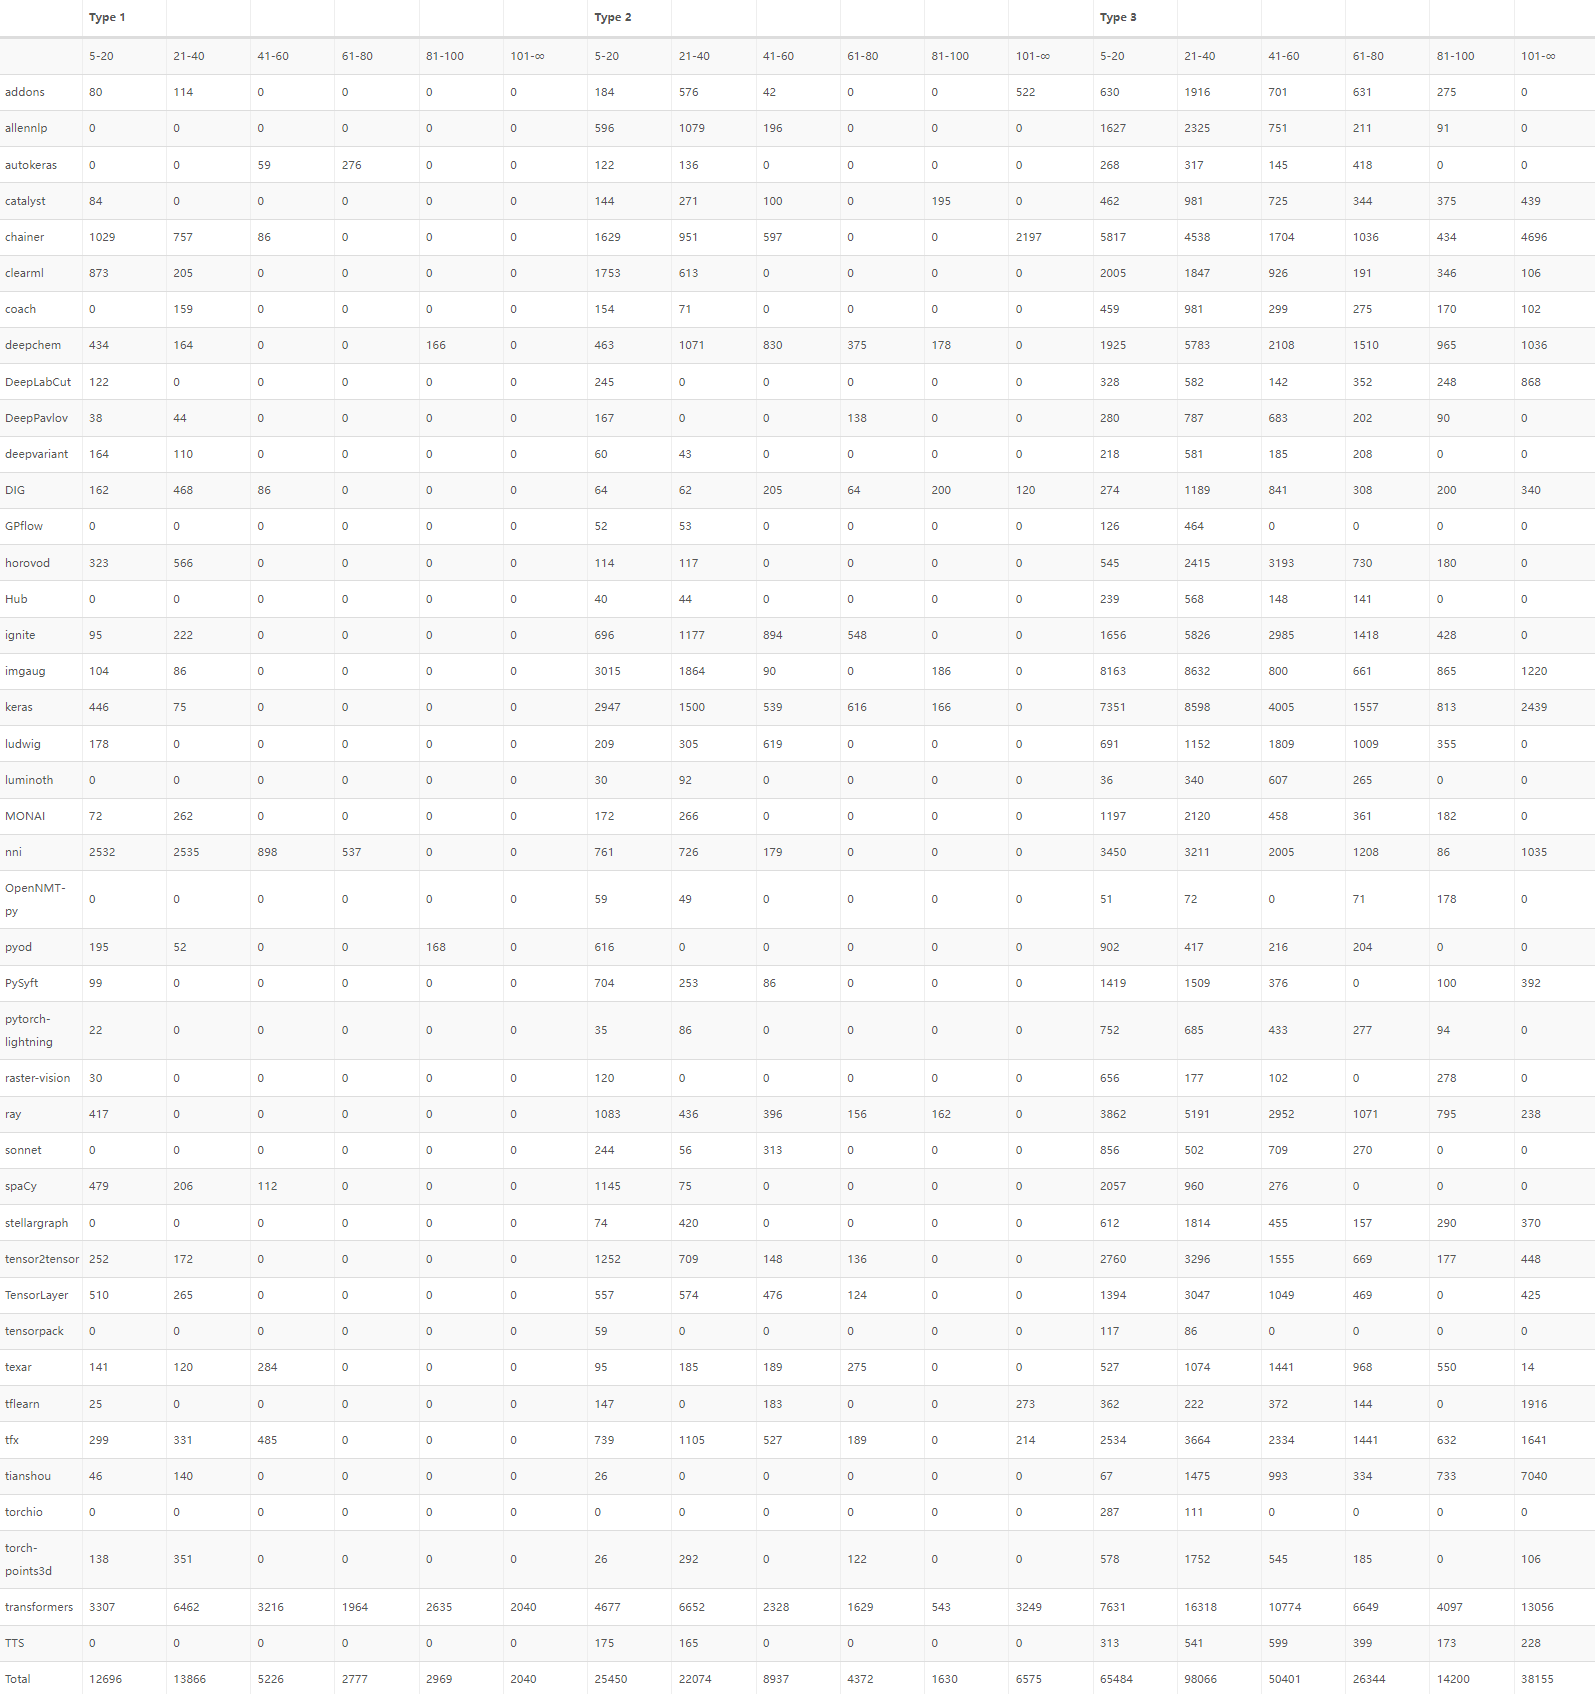
Distribution of the gross LOC of each clone type in every group.
| 5-20 | 21-40 | 41-60 | 61-80 | 81-100 | 101-∞ | |
|---|---|---|---|---|---|---|
| Type 1 | 12696 | 13866 | 5226 | 2777 | 2969 | 2040 |
| Type 2 | 25450 | 22074 | 8937 | 4372 | 1630 | 6575 |
| Type 3 | 65484 | 98066 | 50401 | 26344 | 14200 | 38155 |
| Total | 103630 | 134006 | 64564 | 33493 | 18799 | 46770 |
Distribution of the gross LOC of each clone type in every group and project.
